Data Analysis
Dashboards | Power BI
Power BI Marketing Performance Dashboard
Gain full-funnel visibility with our Power BI Marketing Dashboard, a multi-platform analytics solution built to empower data-driven decision-making. This dashboard unifies performance metrics across Facebook, LinkedIn, Instagram, Snapchat, TikTok, and Google Analytics, enabling precise campaign analysis and optimization.
Key Features Include:
Ad Spend, Revenue & ROAS Breakdown across campaigns
Channel-wise Traffic & Click Metrics with performance benchmarking
Engagement Trends across platforms and geographies
Audience Insights by device, gender, and country
Post Analytics by impressions, likes, shares, and new followers
Conversion & Cost Metrics (CPC, CPL, CTR, Conversion Rate)
Ideal for marketing strategists and digital advertisers, this dashboard offers a real-time pulse on campaign ROI and creative effectiveness.
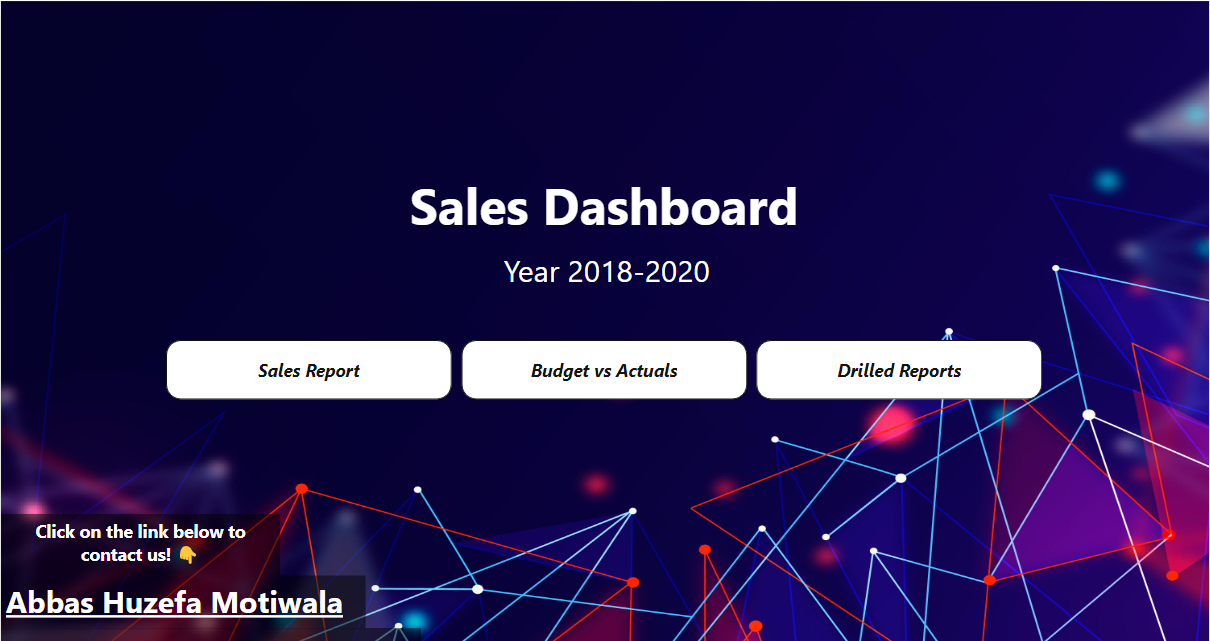
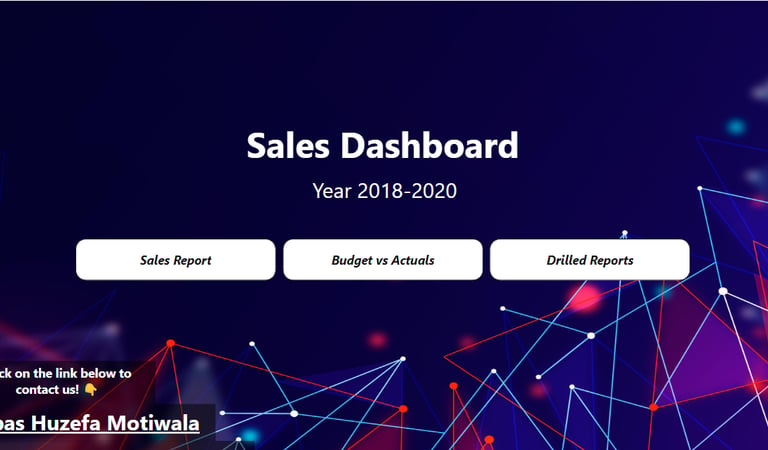
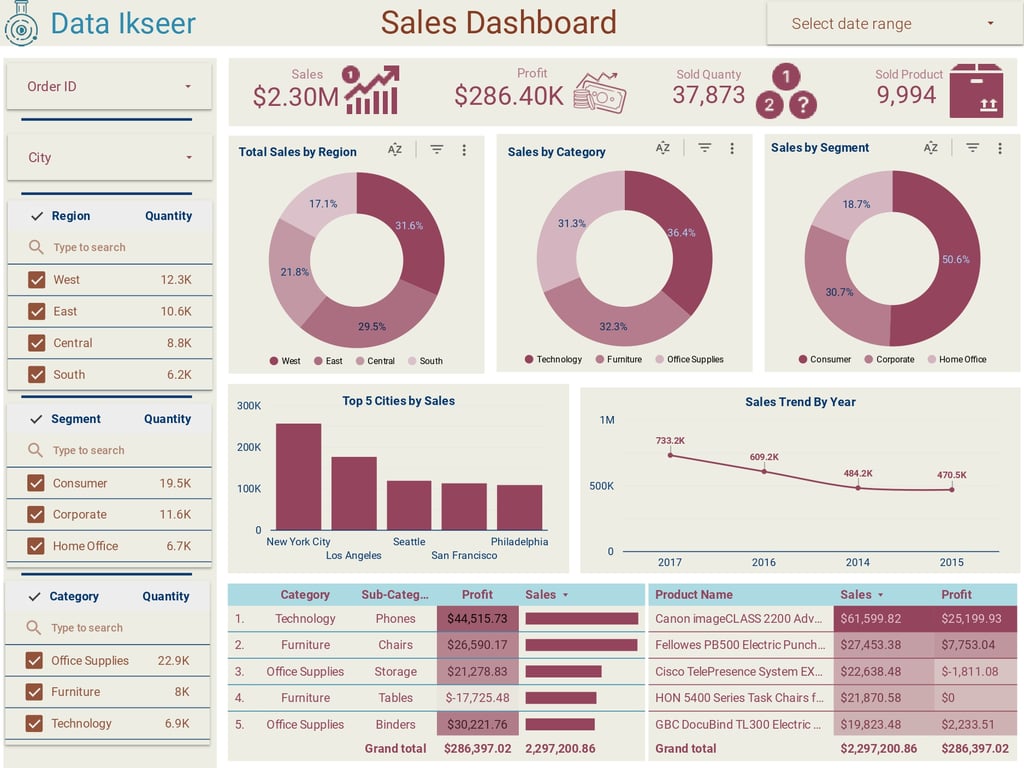
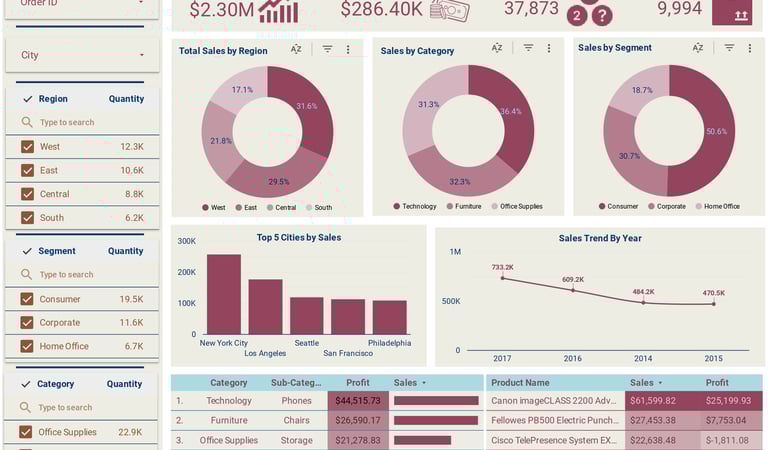
Sales Dashboard
This sales dashboard in Power BI provides a comprehensive overview of sales performance from 2018 to 2020. Designed to be user-friendly, the dashboard offers three main sections:
Sales Report: This section provides detailed insights into the sales figures across different regions, products, and periods. Users can explore trends and patterns to understand how sales have evolved over the selected timeframe.
Budget vs Actuals: This section compares the actual sales performance against the budgeted targets. It helps users identify gaps between planned and actual performance, offering critical insights into areas where targets were met or missed.
Drilled Reports: This section allows users to dive deeper into the data, providing detailed, drill-down reports on specific metrics or categories. It is ideal for users who need to analyze data at a granular level.
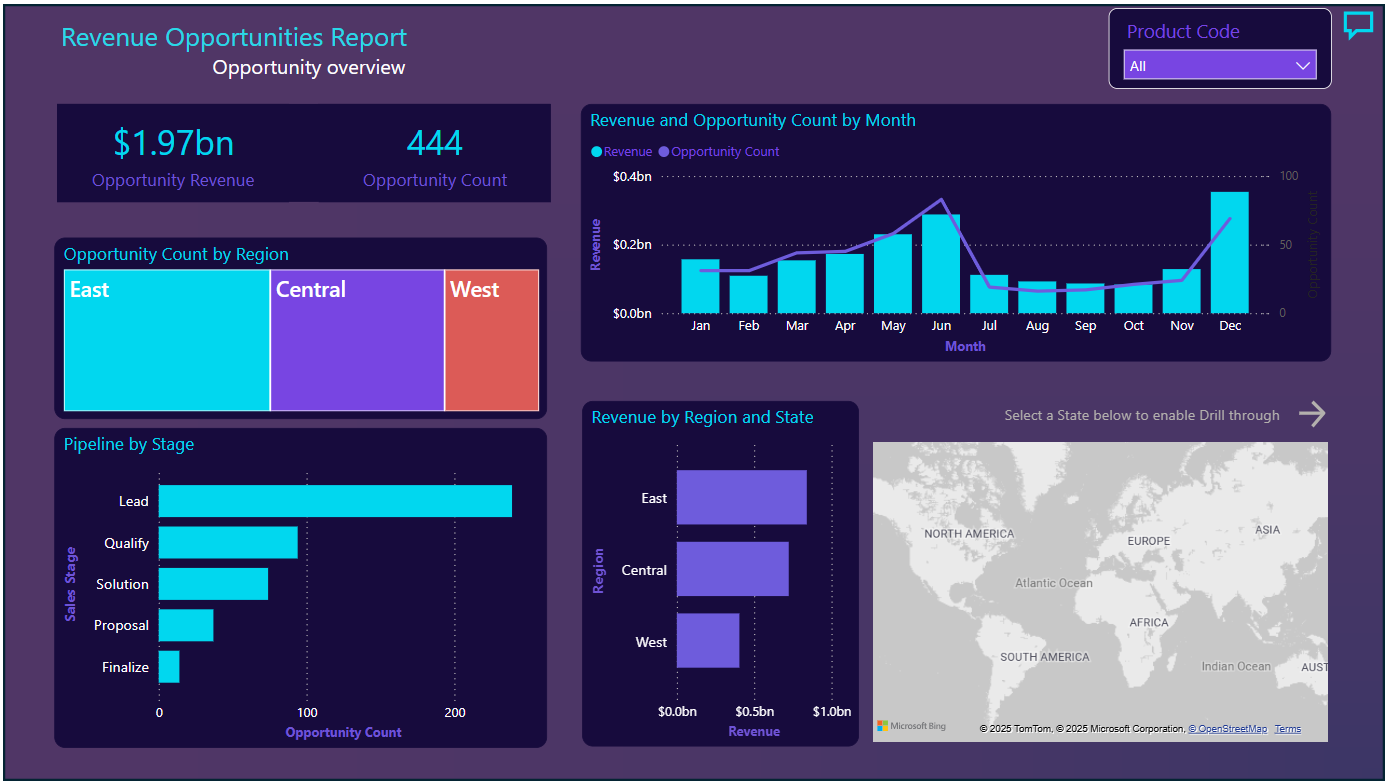
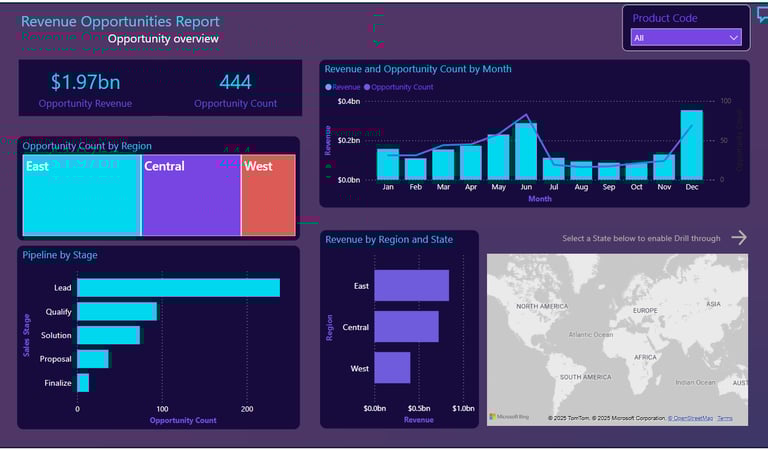
Revenue Opportunities Dashboard
Discover key insights with our interactive Revenue Opportunities Dashboard, built using Google Sheets and integrated with dynamic data visualization tools. This dashboard provides a clear snapshot of:
Total Opportunity Revenue and Count
Revenue and Opportunity Trends by Month
Regional Performance Breakdown (East, Central, West)
Pipeline Stages from Lead to Finalization
Interactive geographic mapping for deeper drill-down
Ideal for sales leaders and strategy teams, this dashboard transforms complex data into actionable opportunities.
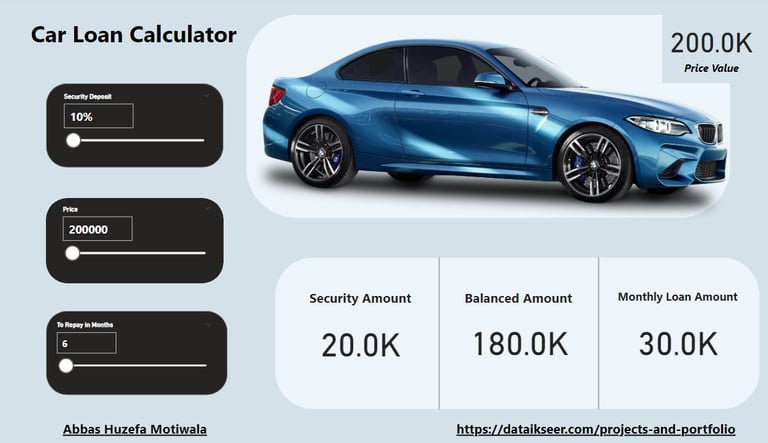
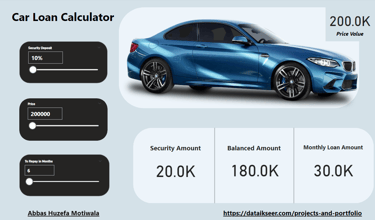
Car Loan Calculator
The Car Loan Calculator dashboard in Power BI provides an interactive interface for users to estimate their car loan details. Users can adjust key parameters including the car's price, the security deposit percentage, and the repayment period in months.
The dashboard dynamically calculates and displays the following:
Security Amount: The initial down payment, calculated as a percentage of the car's total price.
Balanced Amount: The remaining loan balance after the security deposit is subtracted from the car's total price.
Monthly Loan Amount: The monthly payment required to repay the loan within the specified time frame.
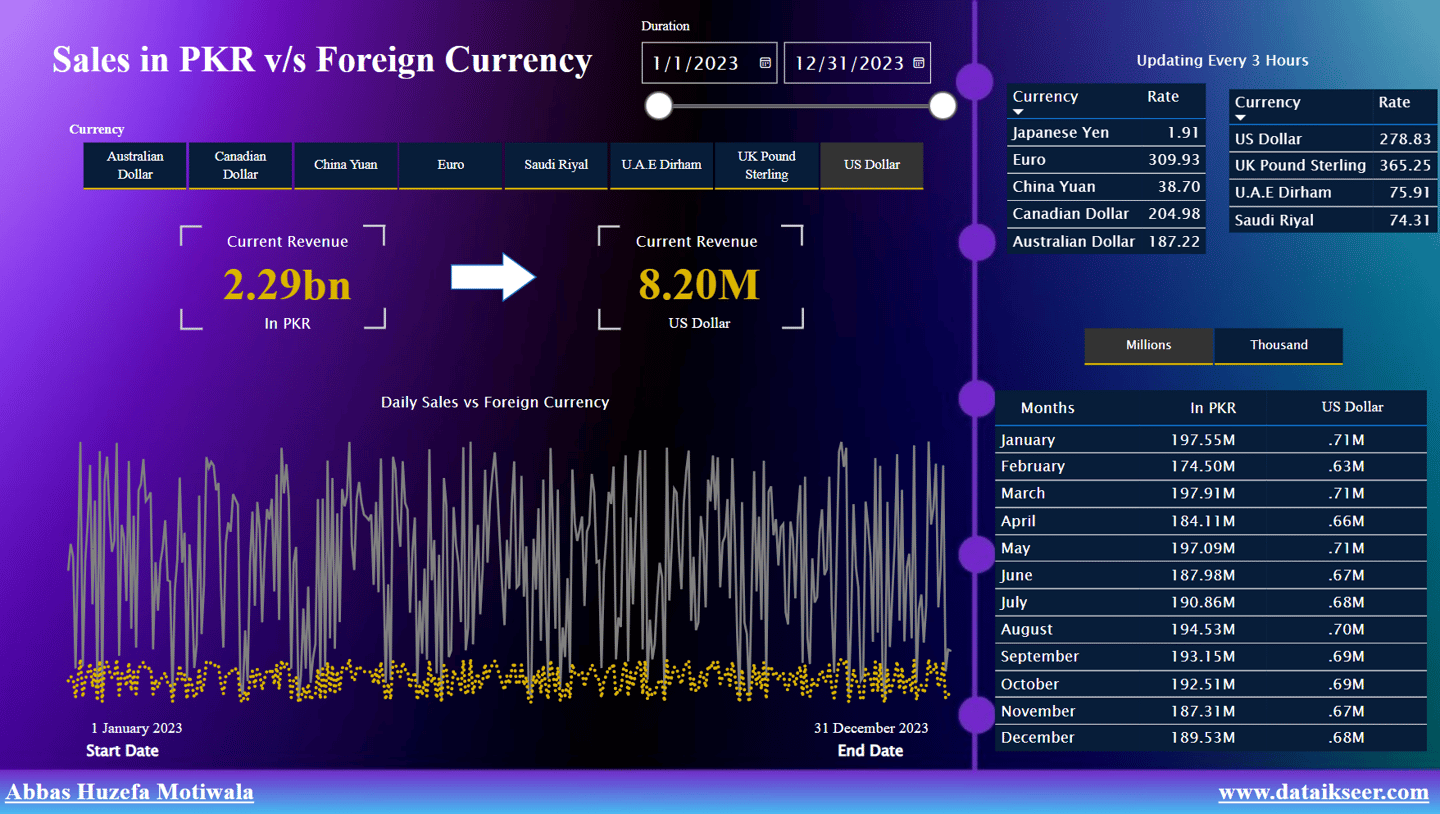
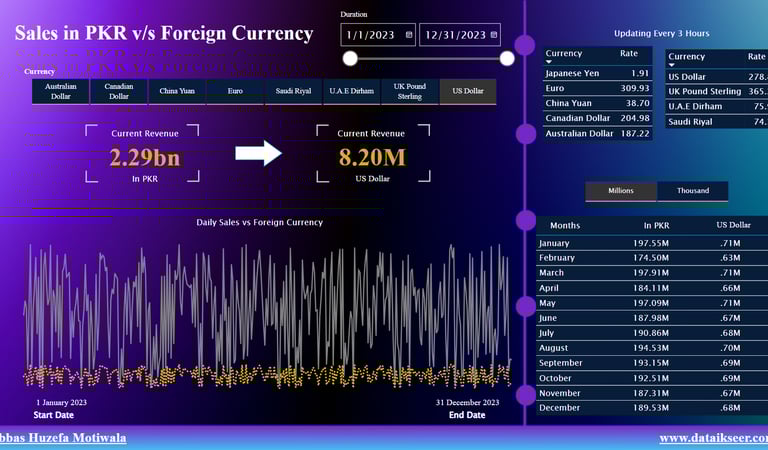
Currency Impact Sales Tracker
This sales dashboard compares Pakistani Rupee (PKR) sales revenue against various foreign currencies in real-time. Key features include:
Currency Comparison: Select and compare sales in PKR with major currencies like USD, Euro, and more.
Time Frame Filter: Analyze sales trends within a customizable time period in 2023.
Daily Sales Chart: Visualizes daily sales against currency fluctuations.
Exchange Rate Updates: Provides exchange rates refreshed every three hours.
Monthly Breakdown: Monthly revenue figures in both PKR and foreign currency.
This tool helps businesses track the impact of currency exchange rates on their sales performance.
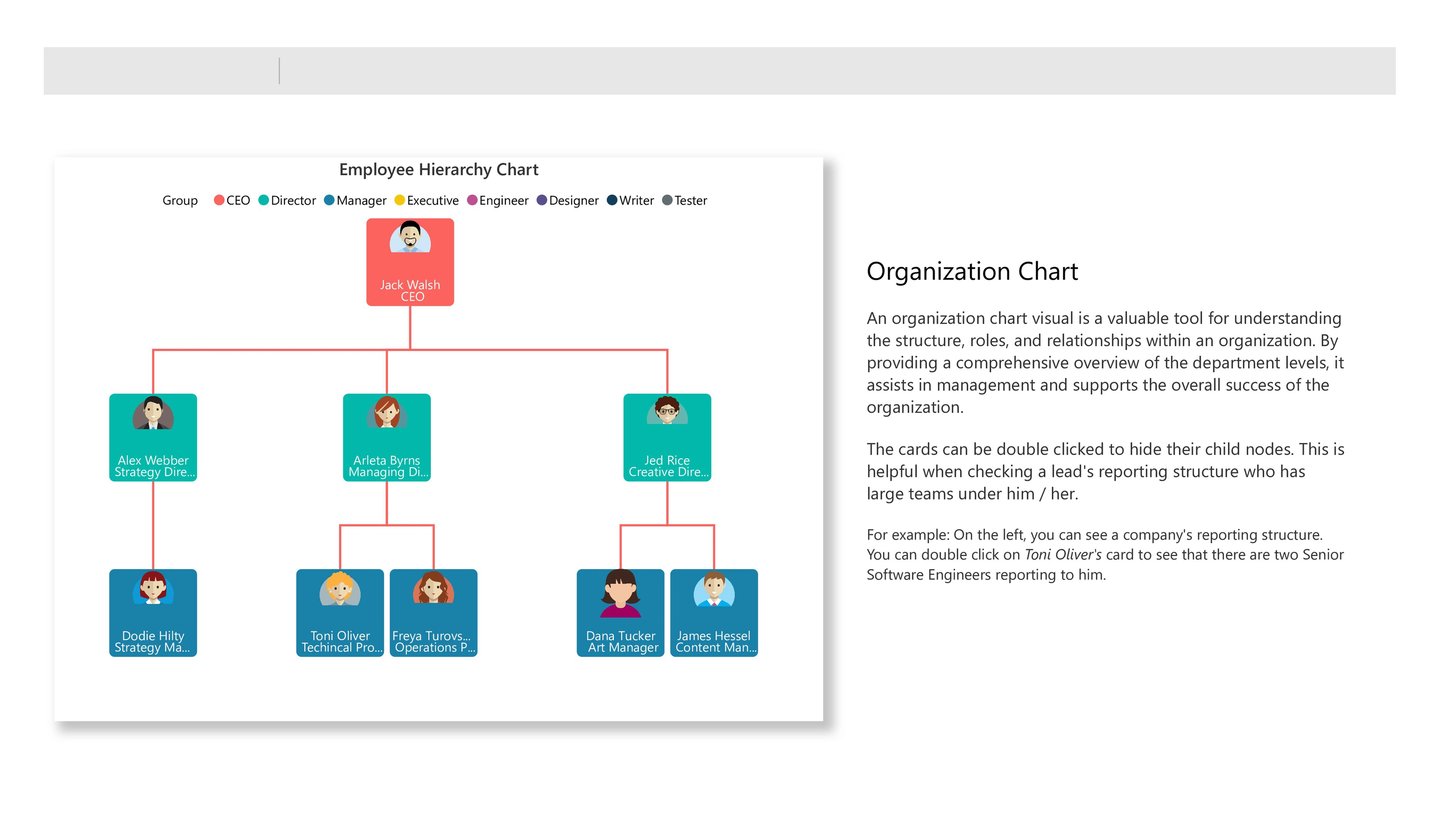
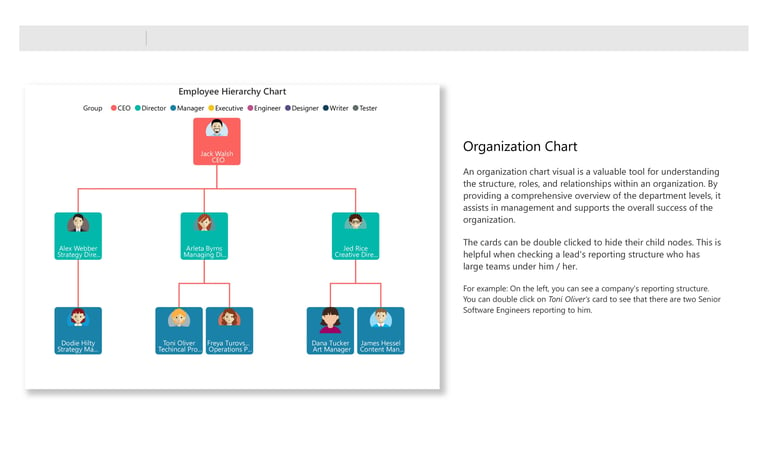
Org Chart Visualizer
This Organizational Chart easily visualizes your organization’s structure with this tool. Key features include:
Drag-and-Drop Customization: Quickly adjust roles and teams as needed.
Clickable Roles: Get detailed info by clicking on any position.
Real-Time Sync: Always up to date with the latest changes.
Zoom and Export: Navigate smoothly and export charts for sharing.
A simple way to keep everyone in the loop on your organizational setup.
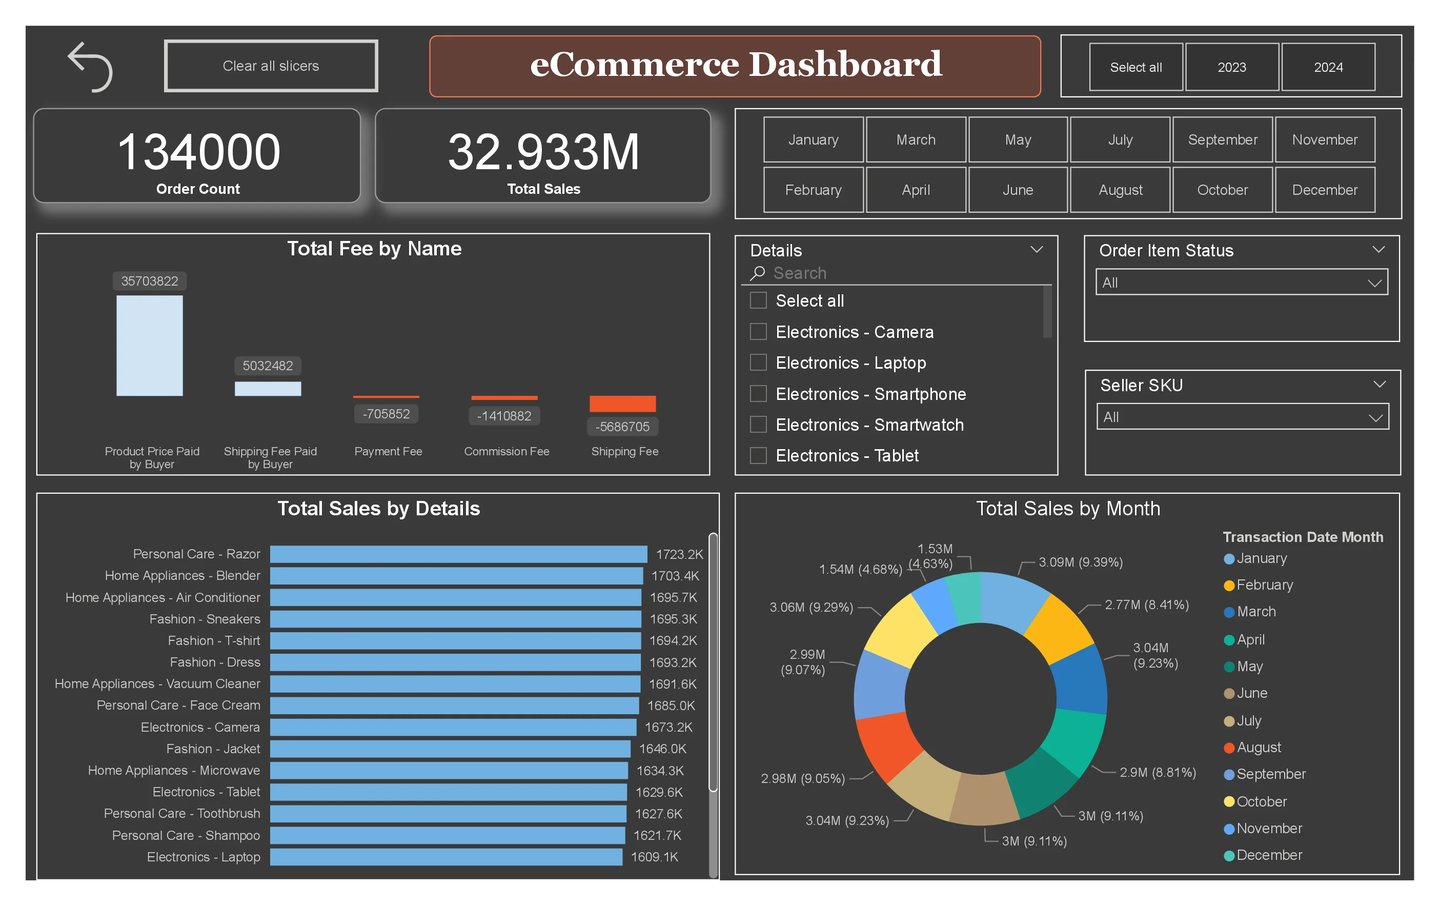
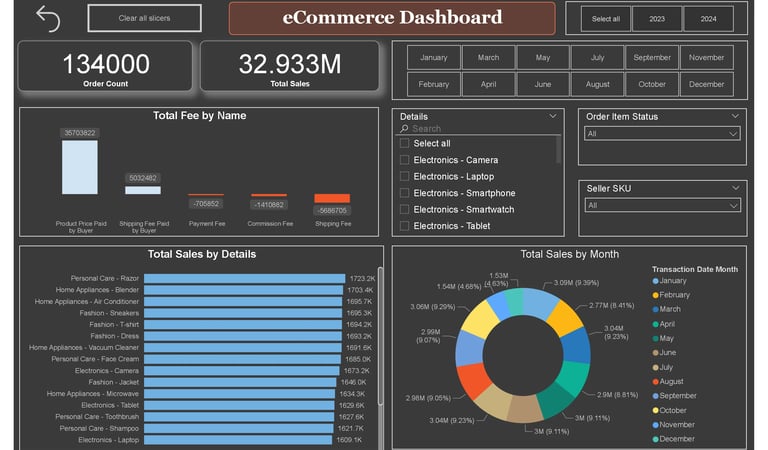
E-commerce Performance Dashboard
This dashboard provides a comprehensive view of the key metrics driving the performance of your eCommerce business. It highlights critical KPIs such as sales revenue, total orders, customer acquisition, and product performance to help you make informed business decisions.
Key Features:
Sales Overview
Visual representation of daily, weekly, and monthly sales trends.
Breakdown by product categories and regions to identify top-performing products and locations.
Order Metrics
Total orders, average order value (AOV), and order conversion rates.
Return rates and refund summaries for better operational insights.
Marketing Performance
Traffic sources, ad campaign performance, and ROI for various marketing channels.
Click-through rates, cart abandonment metrics, and sales funnel efficiency.
Looker Studio -
Google Search Campaign Performance Overview
This Search Console-Based Performance Report showcases a detailed view of campaign effectiveness across Google platforms and geographic regions. Built for marketing analysts and advertisers, it consolidates key campaign metrics into actionable insights.
Key insights include:
Campaign-level spend vs. revenue tracking
Top-performing lead gen efforts, retargeting, and website visits
Country-wise traffic breakdown (Impressions, Clicks)
Platform distribution across LinkedIn, Instagram, Facebook, and more
This dashboard empowers data-driven decisions and performance optimization for digital ad campaigns, all powered through Google Search Console data.


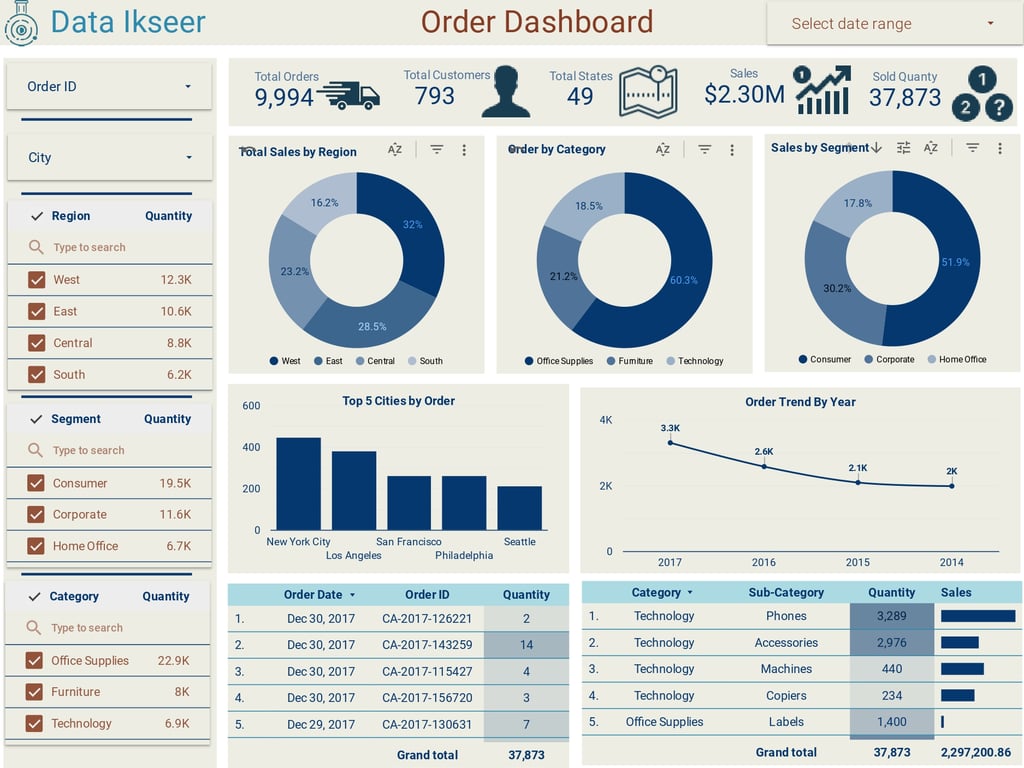
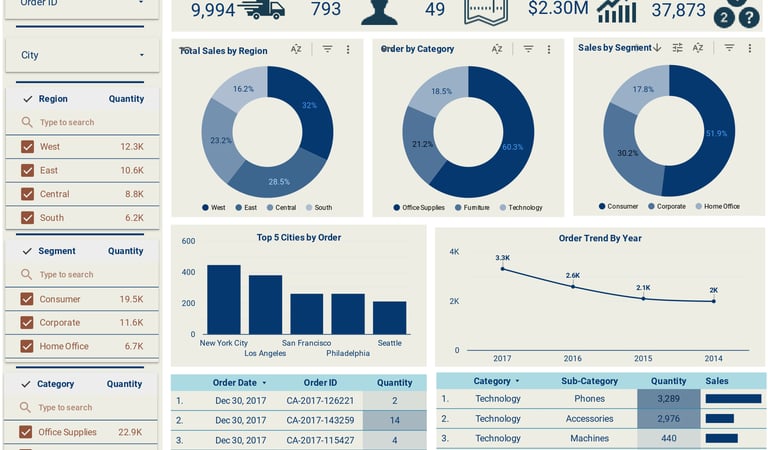
Looker Studio -
Interactive Sales & Order Dashboard
Stay on top of your business performance with our dynamic Google Sheets-based dashboard. Designed for clarity and insight, this portfolio tool delivers real-time views of:
Regional sales distribution and top-performing states
Orders segmented by category and customer type
Trends across multiple years
Key city-wise sales performance
Most profitable products and categories
Perfect for data-driven decisions, this dashboard combines simplicity with power — no coding required.
More dashboards of our clients' are currently undergoing refinement to be showcased publicly as part of our portfolio.
Meanwhile, please feel free to explore our other projects and testimonials.

DataIkseer.com © 2026 Data Ikseer. Transforming Data into Insights.
Company
Contact
Location: Saify Foundation Building, 2nd Floor, #202, Mansfield Street, Dr Syedna Mohammed Burhanuddin Road, Saddar, Karachi 74100, Pakistan
Legal